# 玖目云(English)
# Login
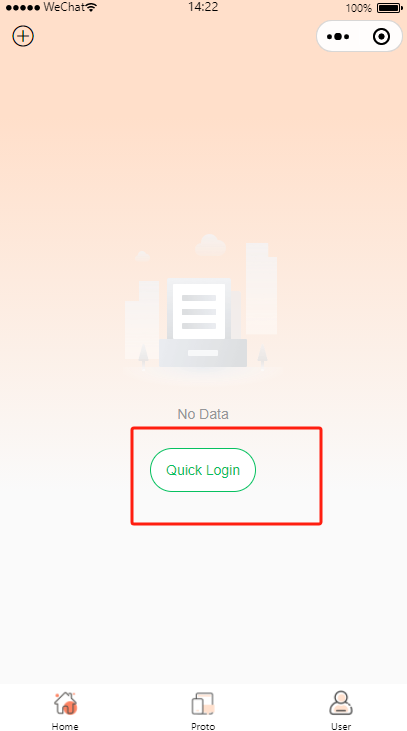
图1.1.1
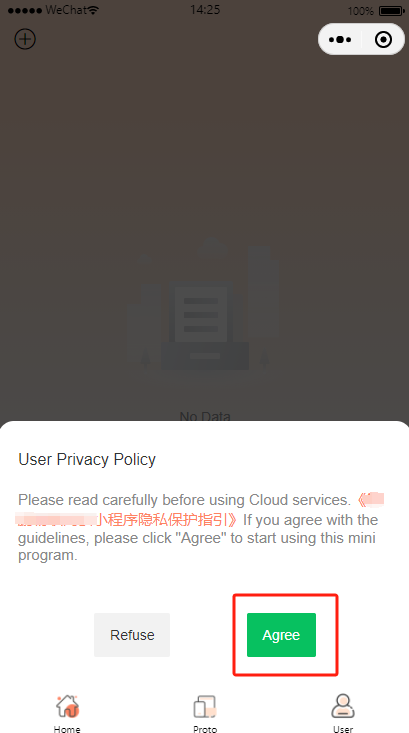
图1.1.2
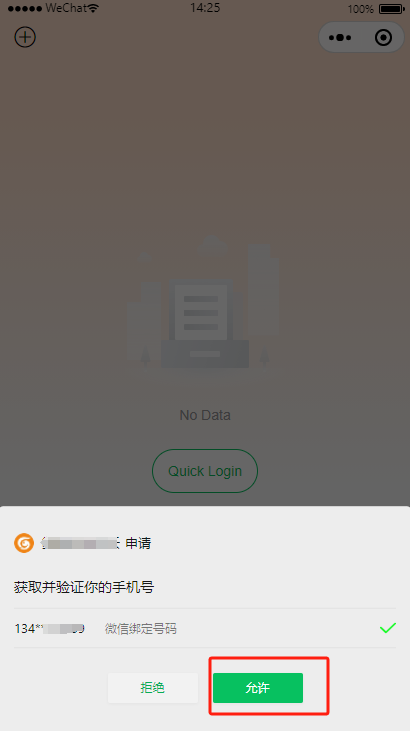
图1.1.3
As shown in Figure 1.1.1, new users enter the home page, and click "Quick Login" . As shown in Figure 1.1.2, read the "玖目云小程序隐私保护指引" and click "Agree". As shown in Figure 1.1.3, enter your cell phone number and click "Allow" to log in the mini program successfully.
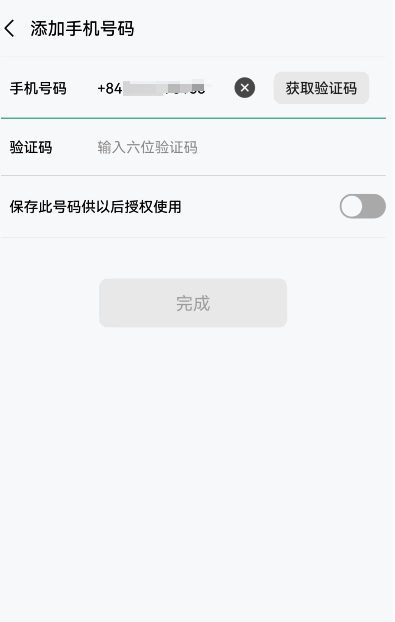
图1.1.4
As shown in Figure 1.1.4, if your cell phone number is an overseas number, please check make sure the correct international area code is added.
# Home Page
# Device List
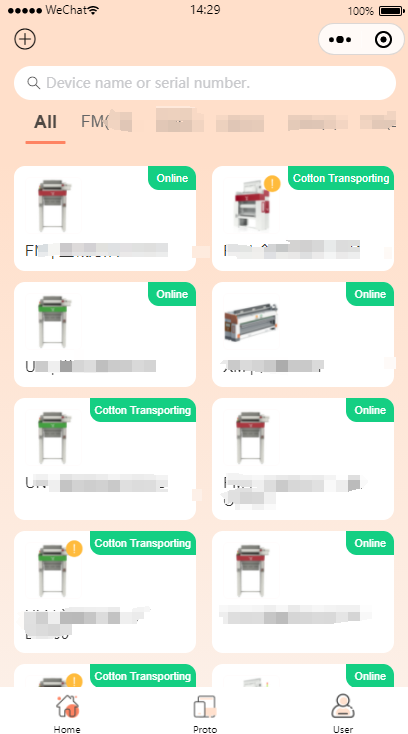
图1.2.1
As shown in Figure 1.2.1, it shows the "Online", "Offline", "Nonactivated" status and name of device.
# Device Details
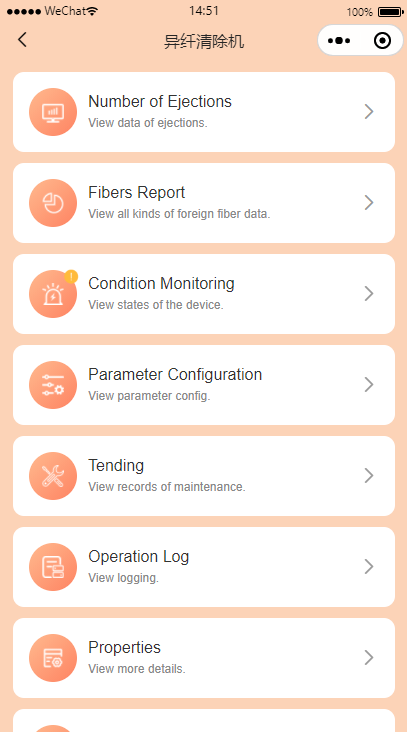
图1.2.2
As shown in Figure 1.2.2, it shows an overview of the device information.
# Number of Ejections
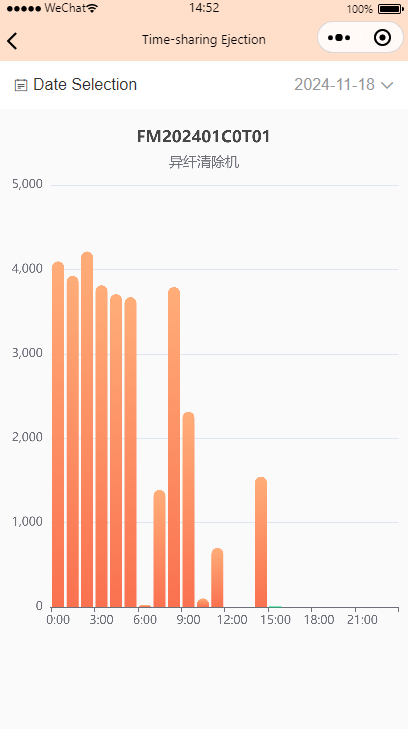
图1.2.3
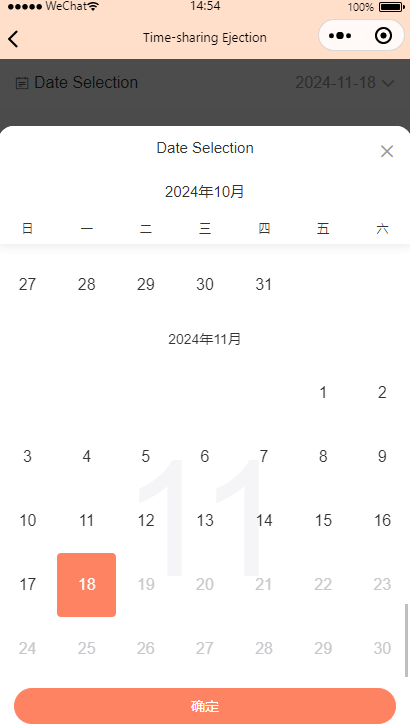
图1.2.4
As shown in Figure 1.2.3, you can see the ejection data for each hour up to the latest time, and the green dashed bar, which indicates the ejection value. As shown in Figure 1.2.4, you can also check the history of ejection data.
# Fibers Report
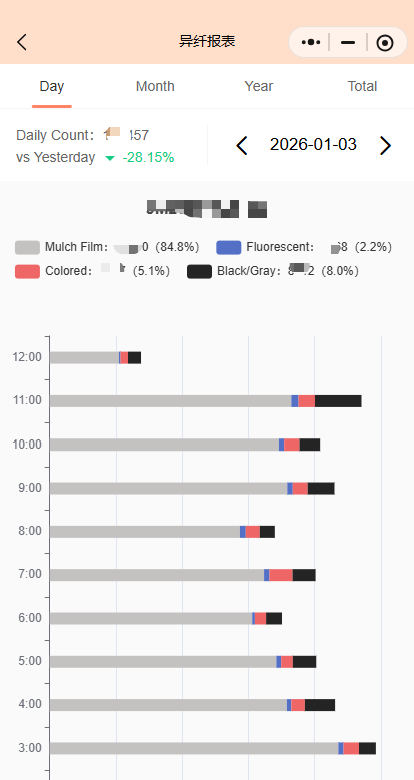
图1.2.5
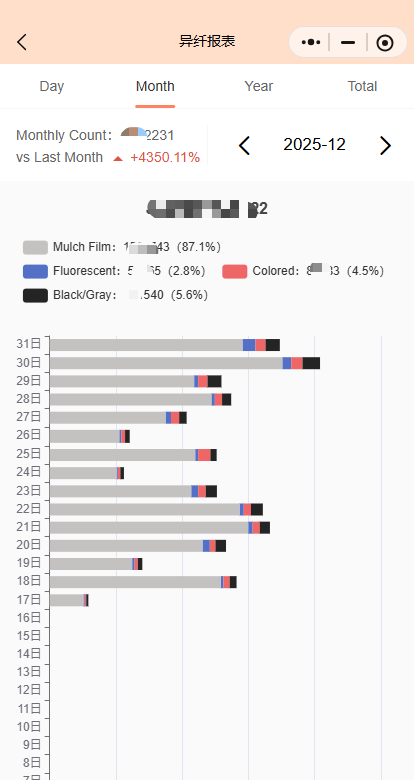
图1.2.50
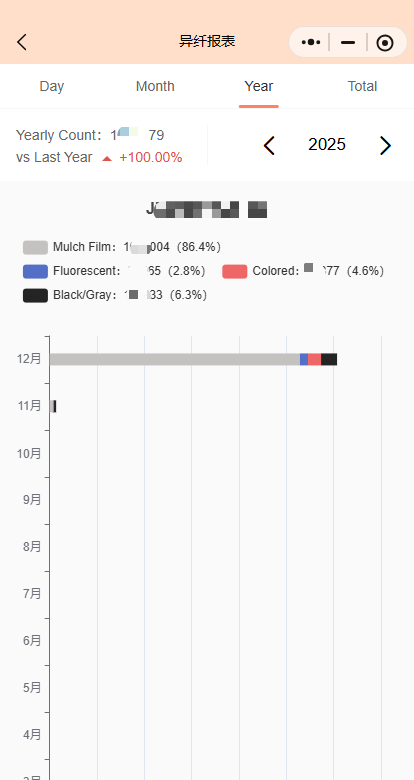
图1.2.51
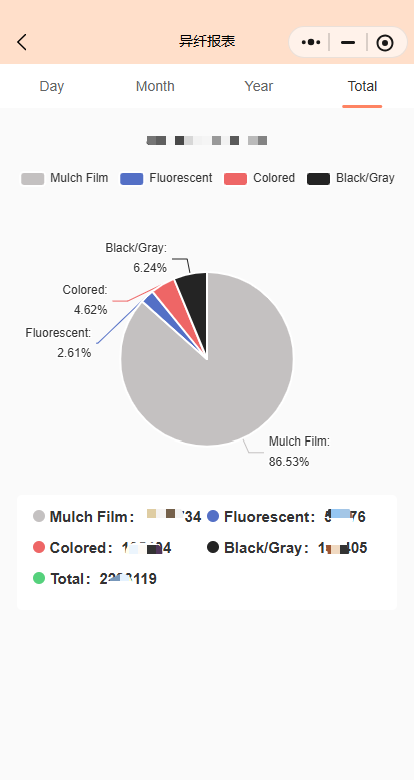
图1.2.52
As shown in Figures 1.2.5, 1.2.50, 1.2.51, and 1.2.52, you can view the foreign fiber data for the current day, current month, current year, and overall data, or select a time period to query historical data.
# Condition Monitoring
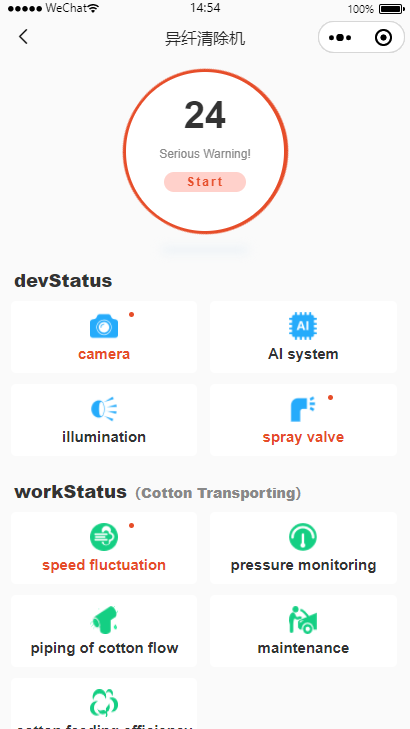
图1.2.6
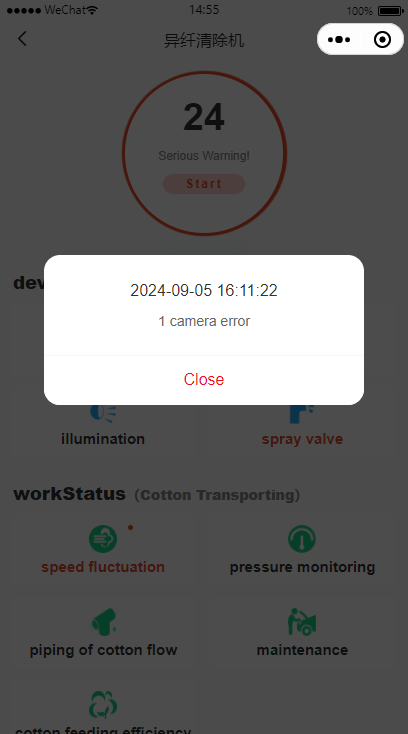
图1.2.7
As shown in Fig. 1.2.6, it shows the alarms of device status and operation status. As shown in Figure 1.2.7, click “Condition Monitoring” to view the alarm content.
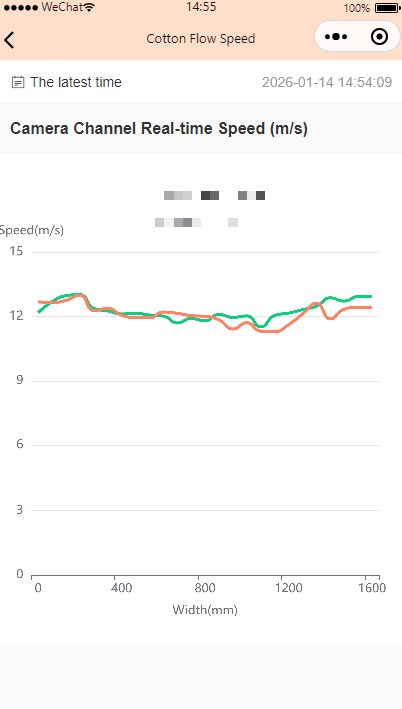
图1.2.8
As shown in Figure 1.2.8, the real-time speed of camera channels for the recent period is displayed.
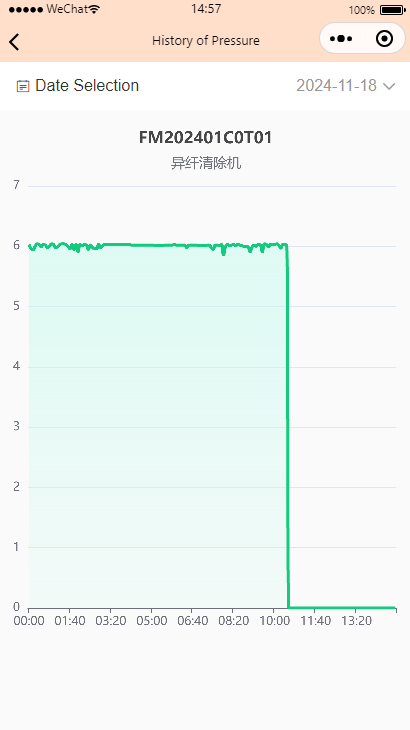
图1.2.9
As shown in Figure 1.2.9, you can see the barometric pressure values for every 5 minutes in the past.
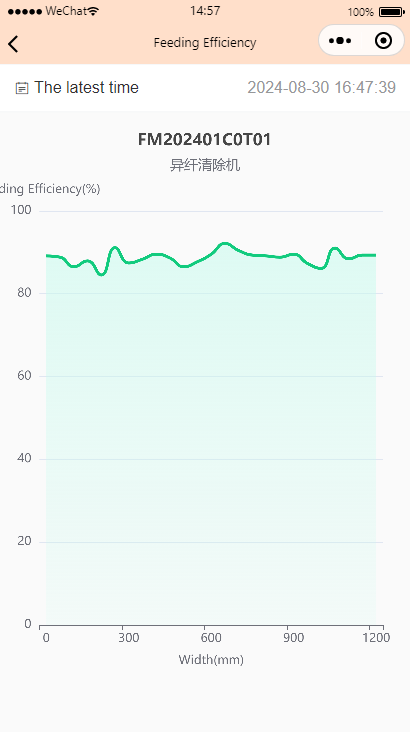
图1.2.10
As shown in Figure 1.2.10, the cotton feeding efficiency is displayed for the recent time.
# Parameter Configuration
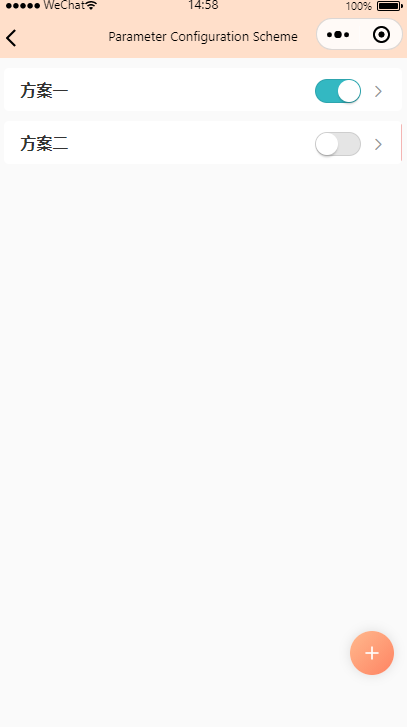
图1.2.11
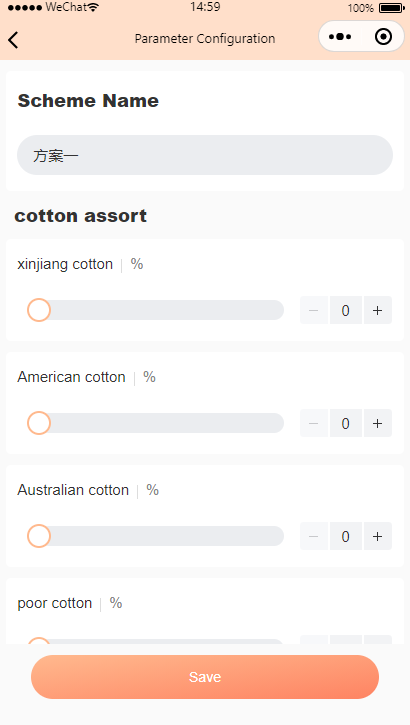
图1.2.12
As shown in Figure 1.2.11, the parameter configuration scheme, you can customize the parameter scheme according to the needs, you can also switch the scheme. As shown in Figure 1.2.12, it shows the specific parameters of parameter configuration.
# Tending
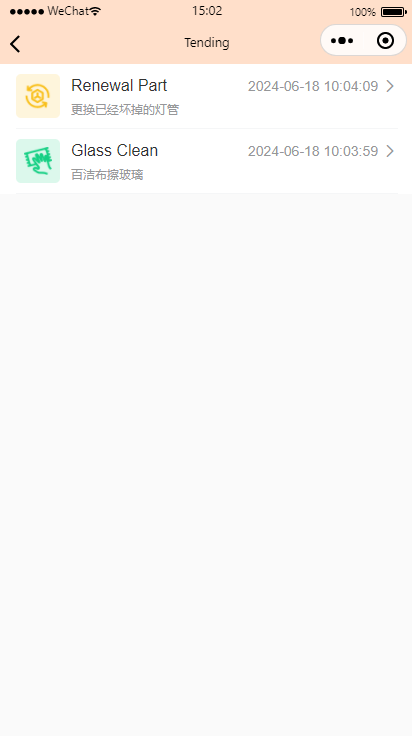
图1.2.13
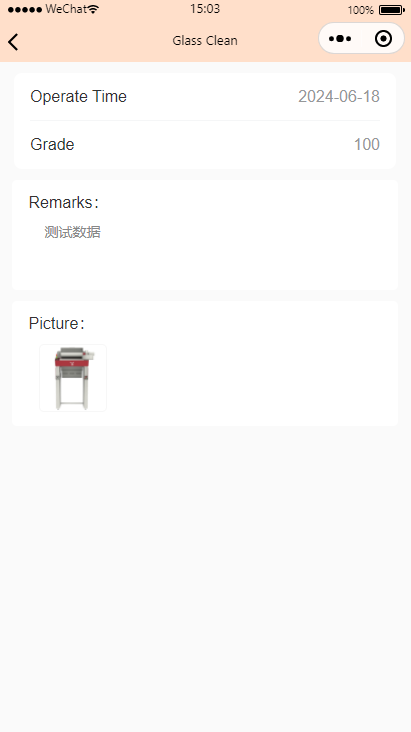
图1.2.14
As shown in Figure 1.2.13, view the maintenance record of the device. As shown in Figure 1.2.14, click “Tending” to view more details.
# Operation Log
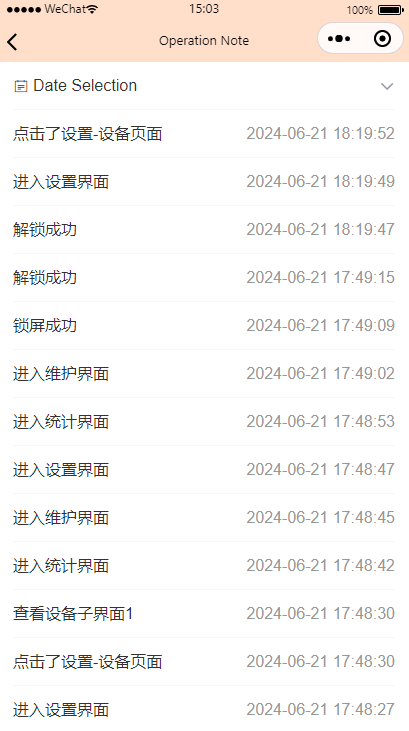
图1.2.15
As shown in Figure 1.2.15, you can check operation log of the upper computer.
# Properties
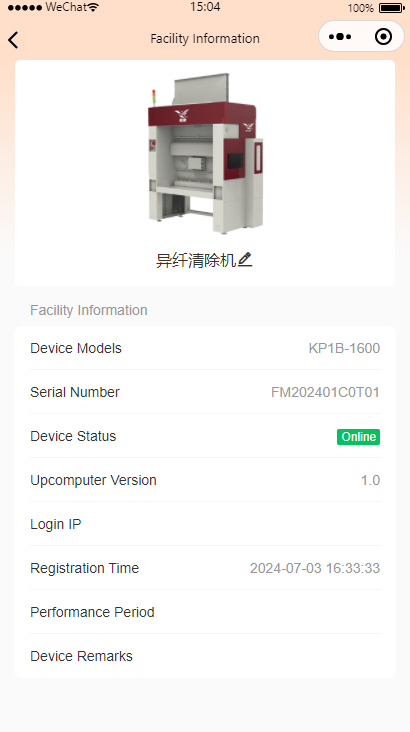
图1.2.16
As shown in Figure 1.2.16, the basic attribute information of the device is displayed, and you can modify it by clicking the name of the device.
# User
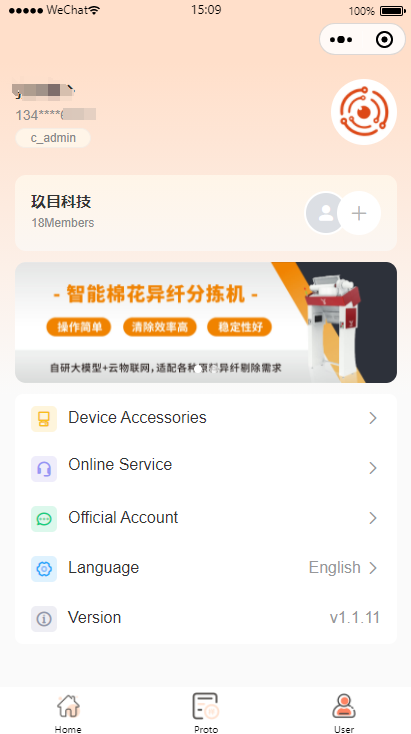
图1.3.1
Enter the mini program and click "User" in the bottom of page, as shown in Figure 1.3.1. The top information bar contains nickname, account and role. The main section contains "device Accessories", "Online Service", "Version" and so on.
# Personal Information
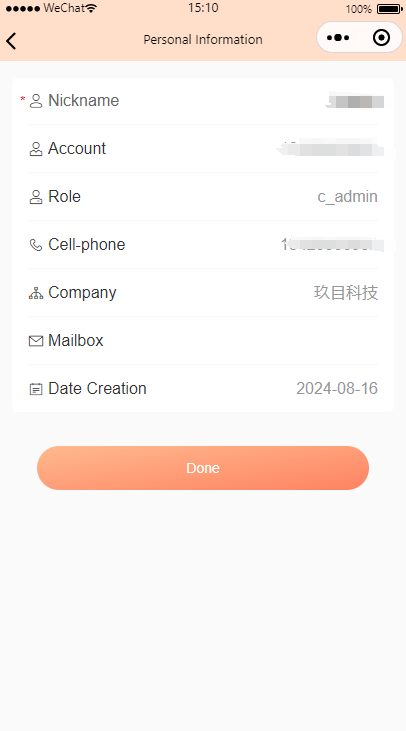
图1.3.2
From “User”page, click the profile picture to enter the Personal Information page. As shown in Figure 1.3.2.
# Member Management
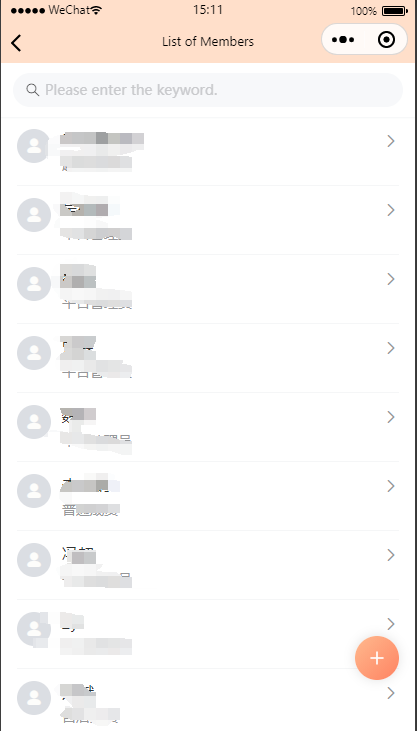
图1.3.3
From “User” Page, click “Company” to enter the member List page. As shown in Figure 1.3.3.
# Invite Members
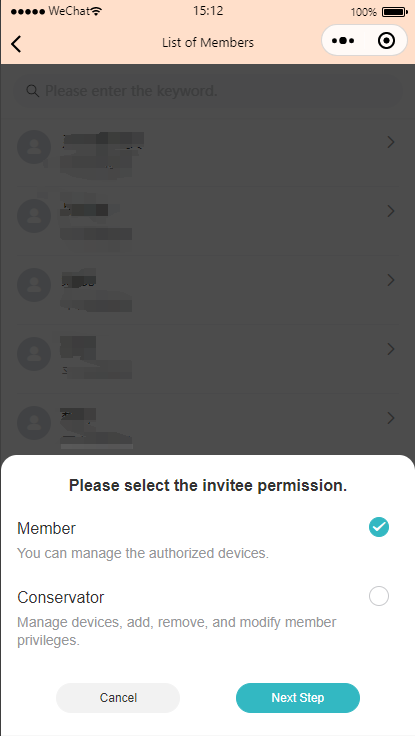
图1.3.4
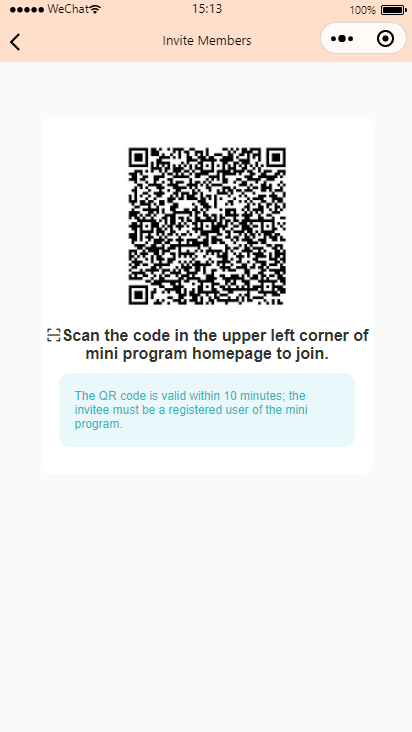
图1.3.5
Click “+” in the bottom right corner of “List of Members” page, to display the invitation pop-up box (as in Figure 1.3.4), select the role, and click “Next Step” to generate the invitation QR code (as in Figure 1.3.5).
# Accept
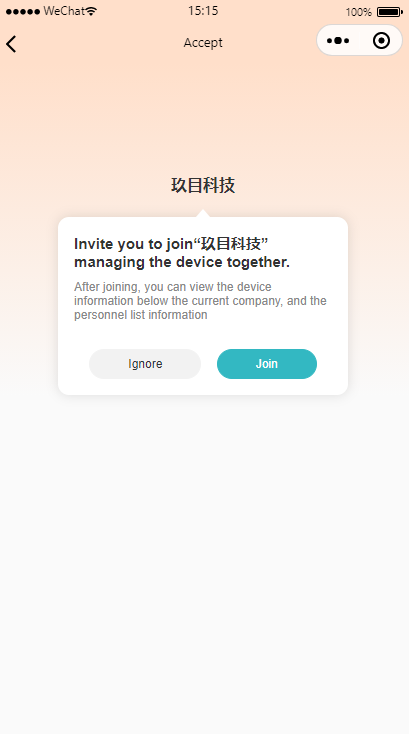
图1.3.6
After invitee enters the mini program, quick login with cell phone number, click the code scanning function at the upper left corner of the homepage, scan the invitation QR code and confirm (as in Figure 1.3.6).
# Member Information
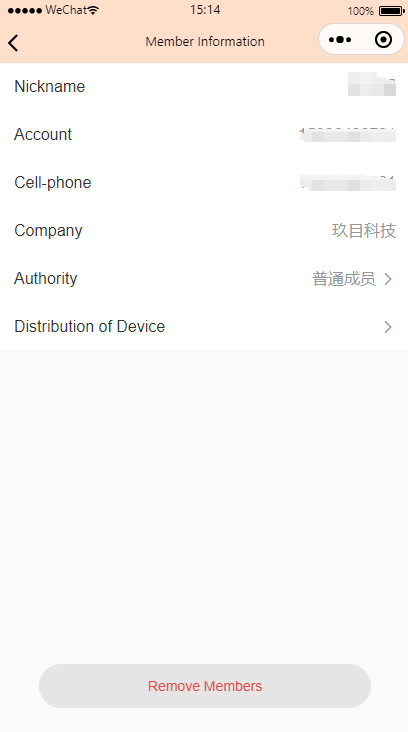
图1.3.7
Click specific member to enter the member information page, you can assign roles and assign device, you can also remove members (as in Figure 1.3.7).